draft
intro
Scientist are obsessed with certained numbers ..
recently 1000
so i decided to write a article on how these technologies can be enhanced via the modern ai, however become many
so if you want to see how we can give AI emotional intelligence or what it can do when combined with devices such as brain-computer interfaces, jump in!
### Physiological computing can also benefit the development of interactive systems. One of the dominant themes in design is human-centered design, which is concerned with incorporating the user’s perspective into the software development process in order to achieve a usable system (Maguire, 2001). However, the HCD approach has been criticized as potentially harmful for trying to optimize the design for a generic “everyman” user. What is needed is the individuation (Hancock et al., 2005) of the interface to the needs of each specific user, something that can be accomplished by measuring the implicit feedback from the user: since the system can adapt in real time to the user’s implicit reactions, the system can continuously calibrate itself to provide the optimal user experience for each individual user.
emoengine etc
I integrate wide variety of sensors in the EmoEngine, but the most trusty workhorse was definitely the legendary Varioport device that was only meant for post-hoc analyses and only supported storing data into the onboard memory-card for later analysis. Thus I had to reverse engineer the crazy ascii-hex-binary protocol it was using to communicate with the proprietary (MS-DOS!) monitoring software by snooping the serial-port connection, figuring out what the bit/hex mess meant, and then writing my own SDK around it to support real-time applications.
In the end I integrated wide number of devices into the EmoEngine, best perhaps illustrated by a project where I set up a whole cloud based, mobile biosignal sonification system using Nokia Maemo phones that ran Linux, and what was the cloud service back then before cloud was even a thing. It worked smoothly, and I could in real-time choose to, for example, sonify in different ways ranging from simple beeps to synthetized music, the heart-rate or any other physiological signal of my colleague(s) that might be located at another continent. This was very revolutionary back in 2009 it was made.
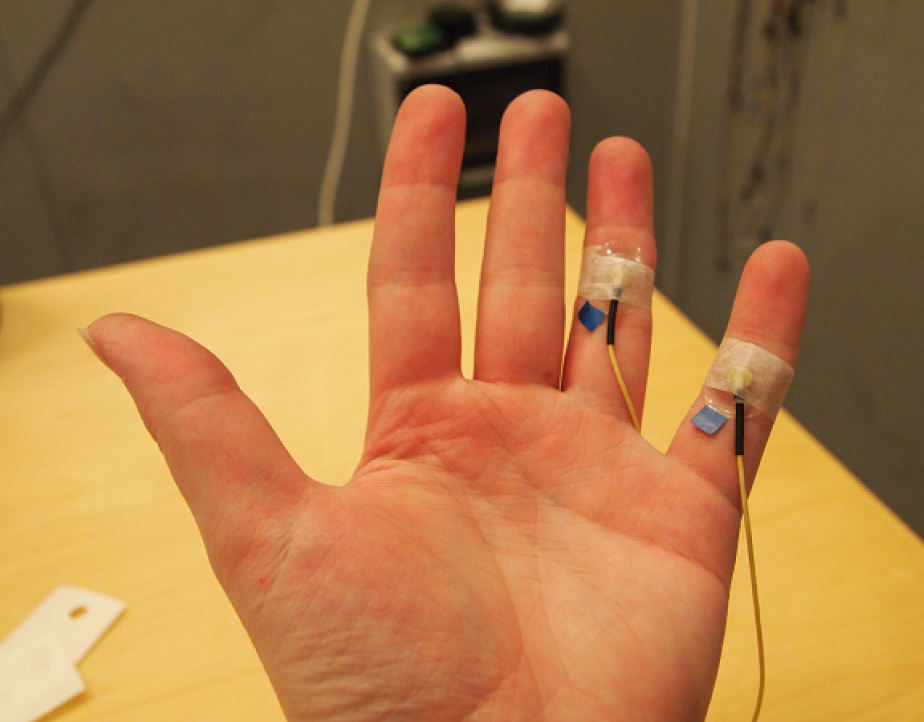
eda games
Emg valence
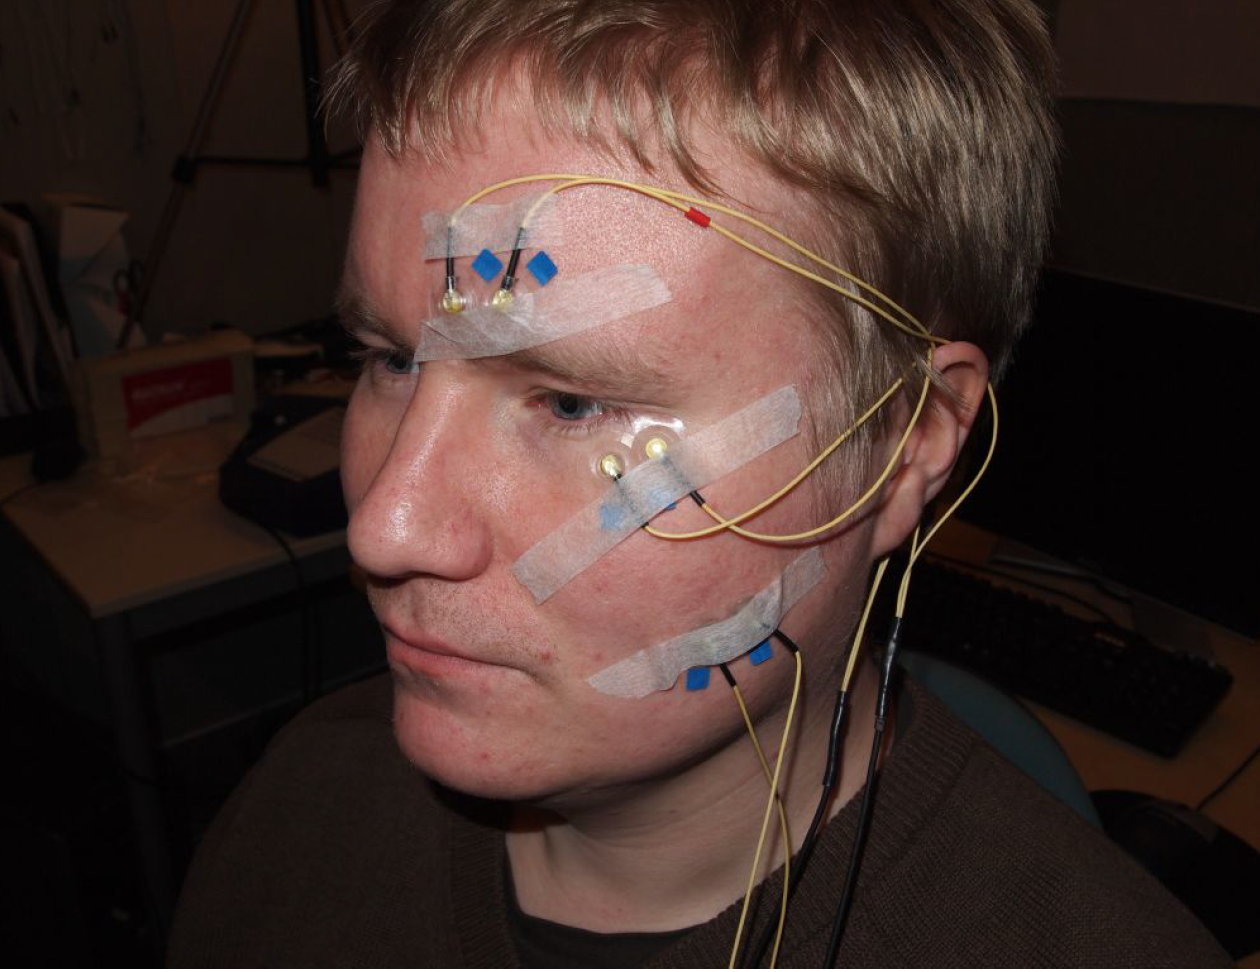
Electromyography refers to measuring and recording of muscle potentials, specifically the activity associated with muscle contractions. While any muscle could provide interesting opportunities for physiological computing, much of the research has traditionally concentrated on facial muscles, since these give fast, reliable, and accurate indicators. Indeed, facial EMG can even detect muscle activity that is not visually perceptible (Ravaja, 2004). Three specific muscles have become the de facto locations in psychophysiological research: the corrugator supercilii (CS), above the eye; the orbicularis oculi (OO), beneath the eye; and the zygomaticus major (ZM), in the cheek. Activity of the CS has been linked to negative valence and concentration, while that of the other two indicates positive valence.
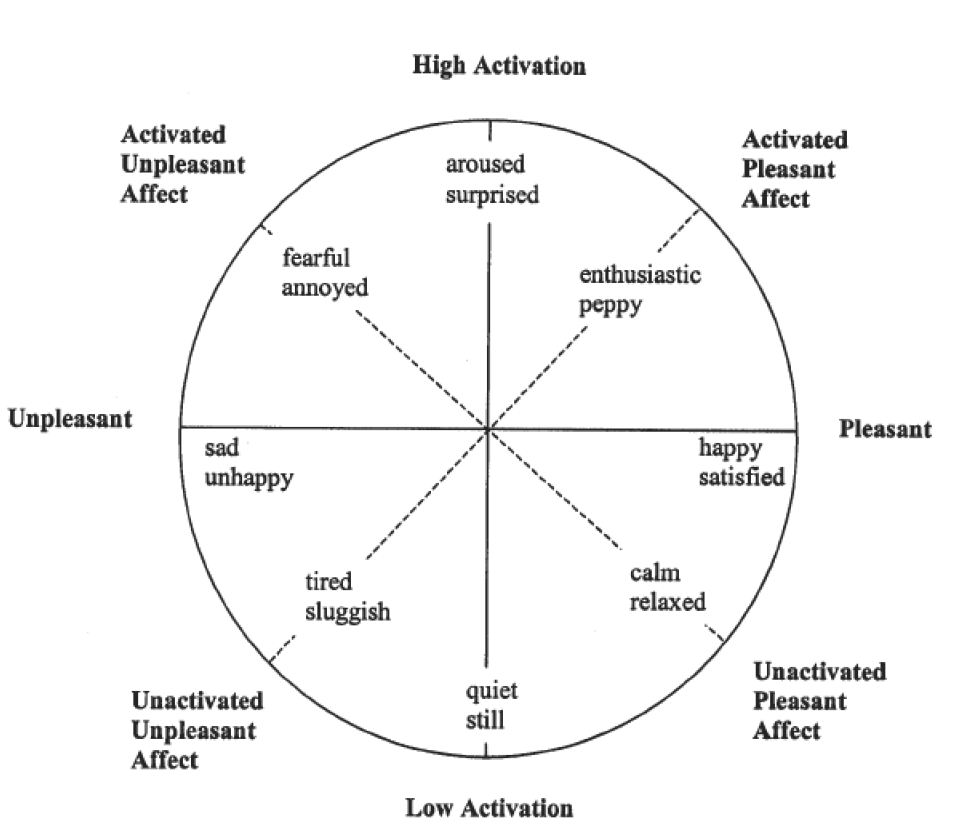
Together with EDA facial EMG allows us to map the user’s affective state into the perhaps most widely used emotional model in HCI, the arousal-valence model:
Facial activity can also be extracted from facial images:
pic
surprisingly also HR.
EMG was used for Publication IV’s study, in which CS activity was used to annotate relevance of articles, and for Publication VI, for which it, CS, OO, and ZM were used to cluster user behavior for game design
ECG/PPG : poker predictions
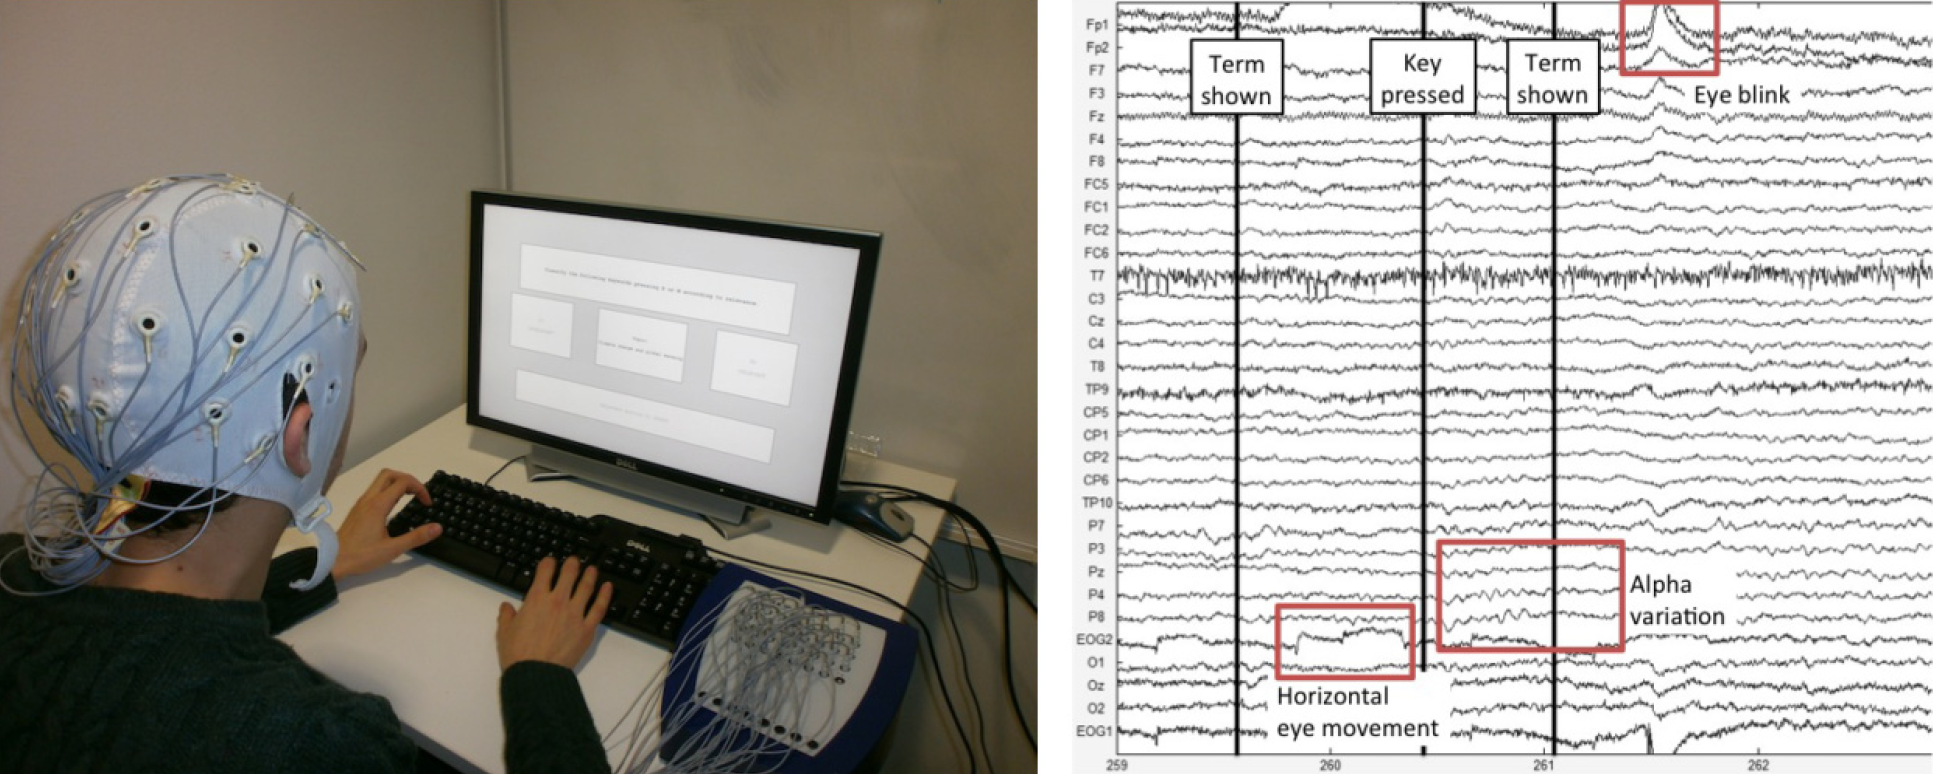
EEG /fnirs bci and relaworld.
Analysis of the EEG signal is divided sharply into two kinds: the signal
can be analyzed in either the frequency or the time domain. In frequencydomain
analysis, rhythmic oscillations in the brain are measured. The
exact cause of these oscillations is still debated, but they have been found
to be relevant for at least coding information, setting and modulating brain
attentional states, and ensuring communication between neuronal populations
around the brain (da Silva, 2013). Several specific oscillation bands
have been defined, such as the delta (0.2–3.5 Hz), theta (4–7.5 Hz), alpha
(8–13 Hz), beta (14–30 Hz), and gamma (30–90 Hz), and each has
its own interpretations for metrics. For example, increased alpha activity
is an indicator of relaxation. Also, the difference in oscillation between
certain sites in the brain can be an important metric, as in the case of
frontal asymmetry. The domain of frequency-based EEG analysis is vast,
and the interested reader is directed to other work (Cowley et al., 2016;
Cacioppo et al., 2007; da Silva, 2013) for details. For Publication I, alpha
and delta activity were used as biofeedback signals, while for Publication
V, gamma-band activity was found to be highly correlated with how funny
people found media content they were browsing.
The other way to interpret the EEG signal is to analyze it in the time
domain, ignoring any frequency patterns. These time-locked analyses deal
with what are known as event-related potentials (ERPs), which are neuronal
potentials that occur in a certain time window after an event has
occurred. Usually,these potentials are so weak – and the signal so full of
noise – that a stimulus is presented multiple times and the EEG response
averaged to get a statistical ERP mean. All ERPs are named on the basis of whether the potential is negative or instead positive and with an indication
of the associated time delay, so, for instance, a positive ERP that
occurs 300 milliseconds after the event is labeled as P300. A very large
amount of research has been done in relation to the various ERPs, something
that Luck refers to in his book as “ERPology” (Luck, 2014). Detailed
description of these too is beyond the scope of this thesis.
We used ERP-based analysis for Publication III, where it was utilized
to predict the relevance of keywords.
after explaining briefly the 4 main signals, go to layers
In this article series I try to cover the main techniques and technologies as well as give real examples and personal anecdotes on working with them.
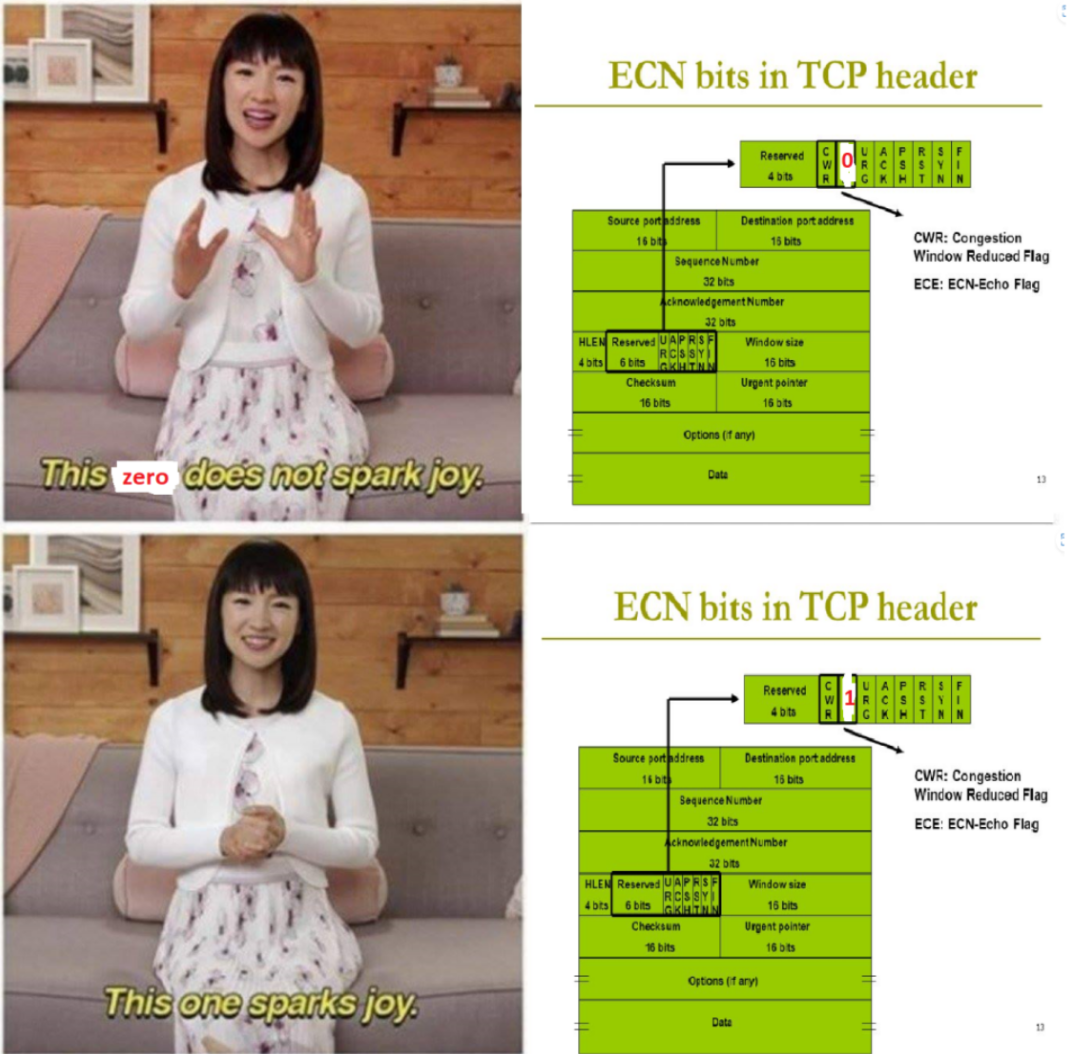
Before my research career I identified myself as a server programmer. I worked few years in creating SMS chat servers in various Unix environments using C language (this was way before any of the model backend solution like node.js or Django, or even C# language let alone the dot.net ecosystem existed) during which I became so intimately familiar with TCP/IP protocol that I could debug remote firewall probles just by glancing at the hexadecimal dump of the TCP headers.
When I started working in physiological computing I wanted to bring the same kind of ideas from the OSI model and create a kind of ‘human-computer’ protocol. This led to my vision of the five-layer model for physiological computing. It was also based on the seminal work that was done when we gathered up a large group of domain experts in physiological computing and wrote a seminal, 160+ page article on how to utilize the various psychophysiological signals.
humancomputerproto pic
In addition to publications as well as having it as the backbone of my Phd thesis, I also was able to get the help of a student group at University of Helsinki who needed a client for their Agile software engineering course. This allowed me to act as a ‘client’ in a half-a-year agile software development process which produced a working web repository based on the five-layer model. link to repo
One of the main questions I explored with the five-layer model was when and where to use machine learning and AI methods and where to have manual logic and algorithms. This question is even more relevant now with the advent of the new wave of generative AI models that might only need to take over part of the stack while some parts are still better left to be fully human controlled.
Dynamics of the Biocybernetic Loop
In my PhD thesis I systematically studied the different time dynamics a biocybernetic loop an take.
Affective computing:
2.4.1 Emotion Theories and Definitions Emotions, moods, and “affects” are mentioned throughout the thesis, not only in the affective computing section, so it is worth addressing the fact that there is a large amount of ambiguity as to their exact meaning. Indeed, there is, as there has been since ancient times, a large amount of debate and disagreement on their definitions and theories based on them. On the other hand, in common parlance, there is often no disagreement at all, with the terms getting used interchangeably (Batson et al., 1992). Ekkekakis (2012) divided the affective phenomena into three groups: • Core affect: The primitive, underlying non-reflective feeling often accompanying mood and emotion but not necessarily always available to consciousness. I can also appear alone without mood or emotion. Examples of core affect include pleasure, relaxation, tension, and tiredness. As an example of how these can be utilized in physiological computing, for Publication I relaxation was used as a user state representation during meditation in virtual reality, and the amount of relaxation was connected to the ability to levitate in the virtual world. • Emotion: Emotion is defined as complex inter-related sub-events directed toward a stimulus (in contrast to core affects, which might have no specific target or object). Emotion also needs to generate overt behavior congruent with the emotion (e.g., a smile) and be connected with a cognitive appraisal of the stimulus and its meaning and implications. As one example of how emotions can be used in physiological computing, for Publication IV the emotional reaction to media content was recorded.
Mood: Mood differs from emotions in that it is usually longer-term and often more global instead of having a specific object as emotions do. Since mood is more of a long-term effect, physiological computing that utilizes moods would have to have a biocybernetic loop that might operate at a slower tempo than usual. One example might be a mindfulness mood journal that gives the individual users feedback on their day-to-day moods. Sometimes, instead of labeling emotions by category (as, for instance, fear or happiness), it is more useful to think of the affective phenomena as a continuous space. This can be especially useful in quantitative analysis and for some machine learning algorithms that are more suitable for such a continuous and analytic model. The most common such model is the circumplex model of emotion (Larsen and Diener, 1992), which maps the affective phenomena in two-dimensional space of arousal and valence. One benefit of the dimensional model is that it corresponds well with the physiological emotion models and is often used in psychophysiological studies (Lang, 1995).
New Holistic Affective Ontology
The above classic emotion theories are way too simplistic for the modern AI systems to fully map the human affective state-space. That is why with my colleages we drafted a plan for a much more comprehensive way of describing the human affective-cognitive processes combing ….. ACII PAper
However
Implicit labeling
As Andrej Karpathy mentioned in his talk on software 2.0, modern AI engineering is much more about explaining (labeling) data than creating new neural network architectures. Physiological computing allows autom…
list of studies… with pics..
Five layers
3.3.1 The Signal Layer
The first layer deals with the physiological signals that have been acquired from the physiological sensors. At this point, the system is dealing with time series of numbers – usually, one real number for each measurement made. Since different signals are often sampled at different rates, the time series can differ between signals in their numbers of values (for example, EDA can be sampled 32 times per second, while EEG and EMG demand sampling rates of 1,000/second or more). Also, some signals, such as the EDA, have only one time-series, while EEG has one series for each electrode, often up to 64 or even more. One very important part of the signal layer is artifact rejection. For example, the processing of EEG often has several steps, such as removing blinks, which cause artifacts and create noise in the data. Techniques such as the Independent Component Analysis (ICA) have been successfully applied (Hyv¨arinen et al., 2004) to separate signals corresponding to the actual brain activity from those generated by eye movements. Another common procedure is use of the deconvolution algorithm applied for the EDA signal. Also, some generic cleaning is often necessary, such as applying a band-pass filter to remove the 50 Hz electrical interference caused by all the electrical devices around us that use alternating current, which also pulsates in all the electrical cabling around us. Again, such details are not central to the topic of this thesis, and the interested reader can consult Cacioppo et al. (2007). The signal layer also deals with topics such as baselining and calibrating the signals. Often when analyzing the signals, we are interested not in absolute measures such as actual skin conductance in Siemens but in the relative change of conductance during an experiment, because the absolute level can change for irrelevant reasons such as room temperature. Hence, at the signal layer the values are centered at some baseline so that they are comparable.
3.3.2 The Metrics Layer
On the next level, the various metrics are extracted from the raw signals. For example, an algorithm parses the raw time series of the EKG signal, picking up the R-spikes that indicate heartbeat, and calculates the heart rate, or, more precisely, the inter-beat interval. Numerous metrics have been developed in psychophysiological research to quantify the activity of the various physiological signals (Cowley et al., 2016). These formulations distill the expert knowledge on the most relevant parts of the signals for
physiological computing. For example, in the complicated EKG signal, which contains several peaks, each with its own shape and amplitude, it has been found that most salient information can be found simply by observing the timing of the R-spikes in order to extract the heart rate. Each signal has such implicit information embedded in the form of the metrics derived from it. In using machine learning methods to automatically generate metrics from a signal, this expert knowledge might not be utilized, but, on the other hand, novel metrics might be found that have not yet been documented. 3.3.3 The Indices Layer The indices layer deals with the conceptual interpretation of the psychophysiological phenomena: it addresses the question of whether emotions should be interpreted categorically (as fear, anger, etc.) or dimensionally (e.g., valence/ arousal). The questions of core affect, mood, and emotion discussed earlier are settled at the indices layer. At this layer, the metrics are used to calculate indices that are useful for the application being developed. For example, the SCR and SCL of EDA can translate to arousal, EEG alpha activity to relaxation, and facial EMG to valence. While some basic affective states such as “arousal” can be reasonably straightforwardly derived from physiological signals, there is some disagreement as to whether emotions have some universal signature that could be used for detecting them (Kreibig, 2010). Barrett (2006) argued that, since emotions are both context-dependent and constructed, finding a priori emotion-specific patterns of autonomic nervous system (ANS) activity is improbable, while meta-analyses by Cacioppo et al. (2007) suggest the possibility of a certain degree of autonomic specificity. Furthermore, some of the indices are inherently context-bound. For example, for publications III and IV, the index being detected is “relevance,” which does not make any sense outside the context. One might say that relevance has intentionality: something in the context is relevant, and talking about relevance without the stimulus that is relevant is meaningless. Therefore, while it might be true generally that emotions do not display a universal signature of the ANS that is always the same for all users, that does not matter as long as the physiological computing system being developed keeps track of the context and claims only that in this given context, given this particular stimulus, the ANS response for this particular emotion will be such and such.
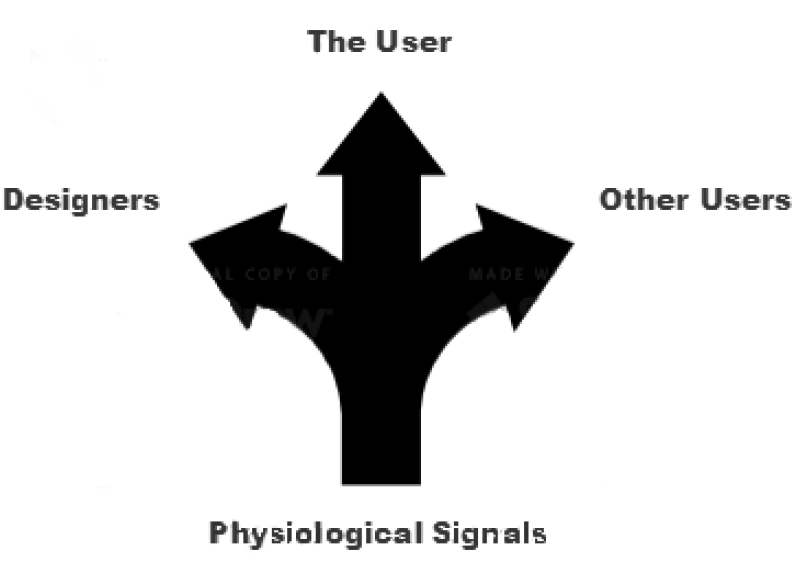
3.3.4 The Logic Layer The next layer, the logic layer, decides how the indices are going to be used. In some applications, the logic layer might, for example, track the user’s level of arousal and trigger some action if the user is getting too excited. Conversely, one of the classic examples of physiological computing is measuring whether pilots or drivers are getting too sleepy to fly/drive and alerting them if necessary. Also, it is possible to combine several indices, possibly for different signals, to generate more intelligent behavior: if we detect high arousal, we also want to know whether the user is showing signs of positive or negative valence, which yield opposite interpretations for the arousal. The logic layer also deals with context-awareness and multimodality – that is, combining input from physiological and non-physiological sources. Temporal patterns too can be handled at this layer. For example, a hidden Markov model can be built to take into account not only the current physiological state but also the history of such states. The lower levels are primarily concerned with phasic, short-term events, while longer-term tonic phenomena that might take place over a period of minutes can be captured in the logic layer. More importantly for this thesis, the logic layer is where the differences in the dynamics of the biocybernetic loop occur. Here the information coming from the indices layer is interpreted, and, on the basis of the loop type, either used to adapt the system for the user in real time or forwarded to a recommender system to improve recommendations for all users, as in the case of affective annotation for collaborative filtering. Or perhaps the stimulus–response pair is simply stored for the designers to use as a guide for further development of the system, in which case the adaptation happens at much slower pace.
3.3.5 The Application Layer The last layer is the application layer, which implements the actual physiological computing application. This final layer implements the four categories of physiological computing: classification, prediction, biofeedback, and entrainment, utilizing the capabilities provided by the logic layer below.
Signal fusion
synchro story.. ms thesis pics / explanation
computational creativity …
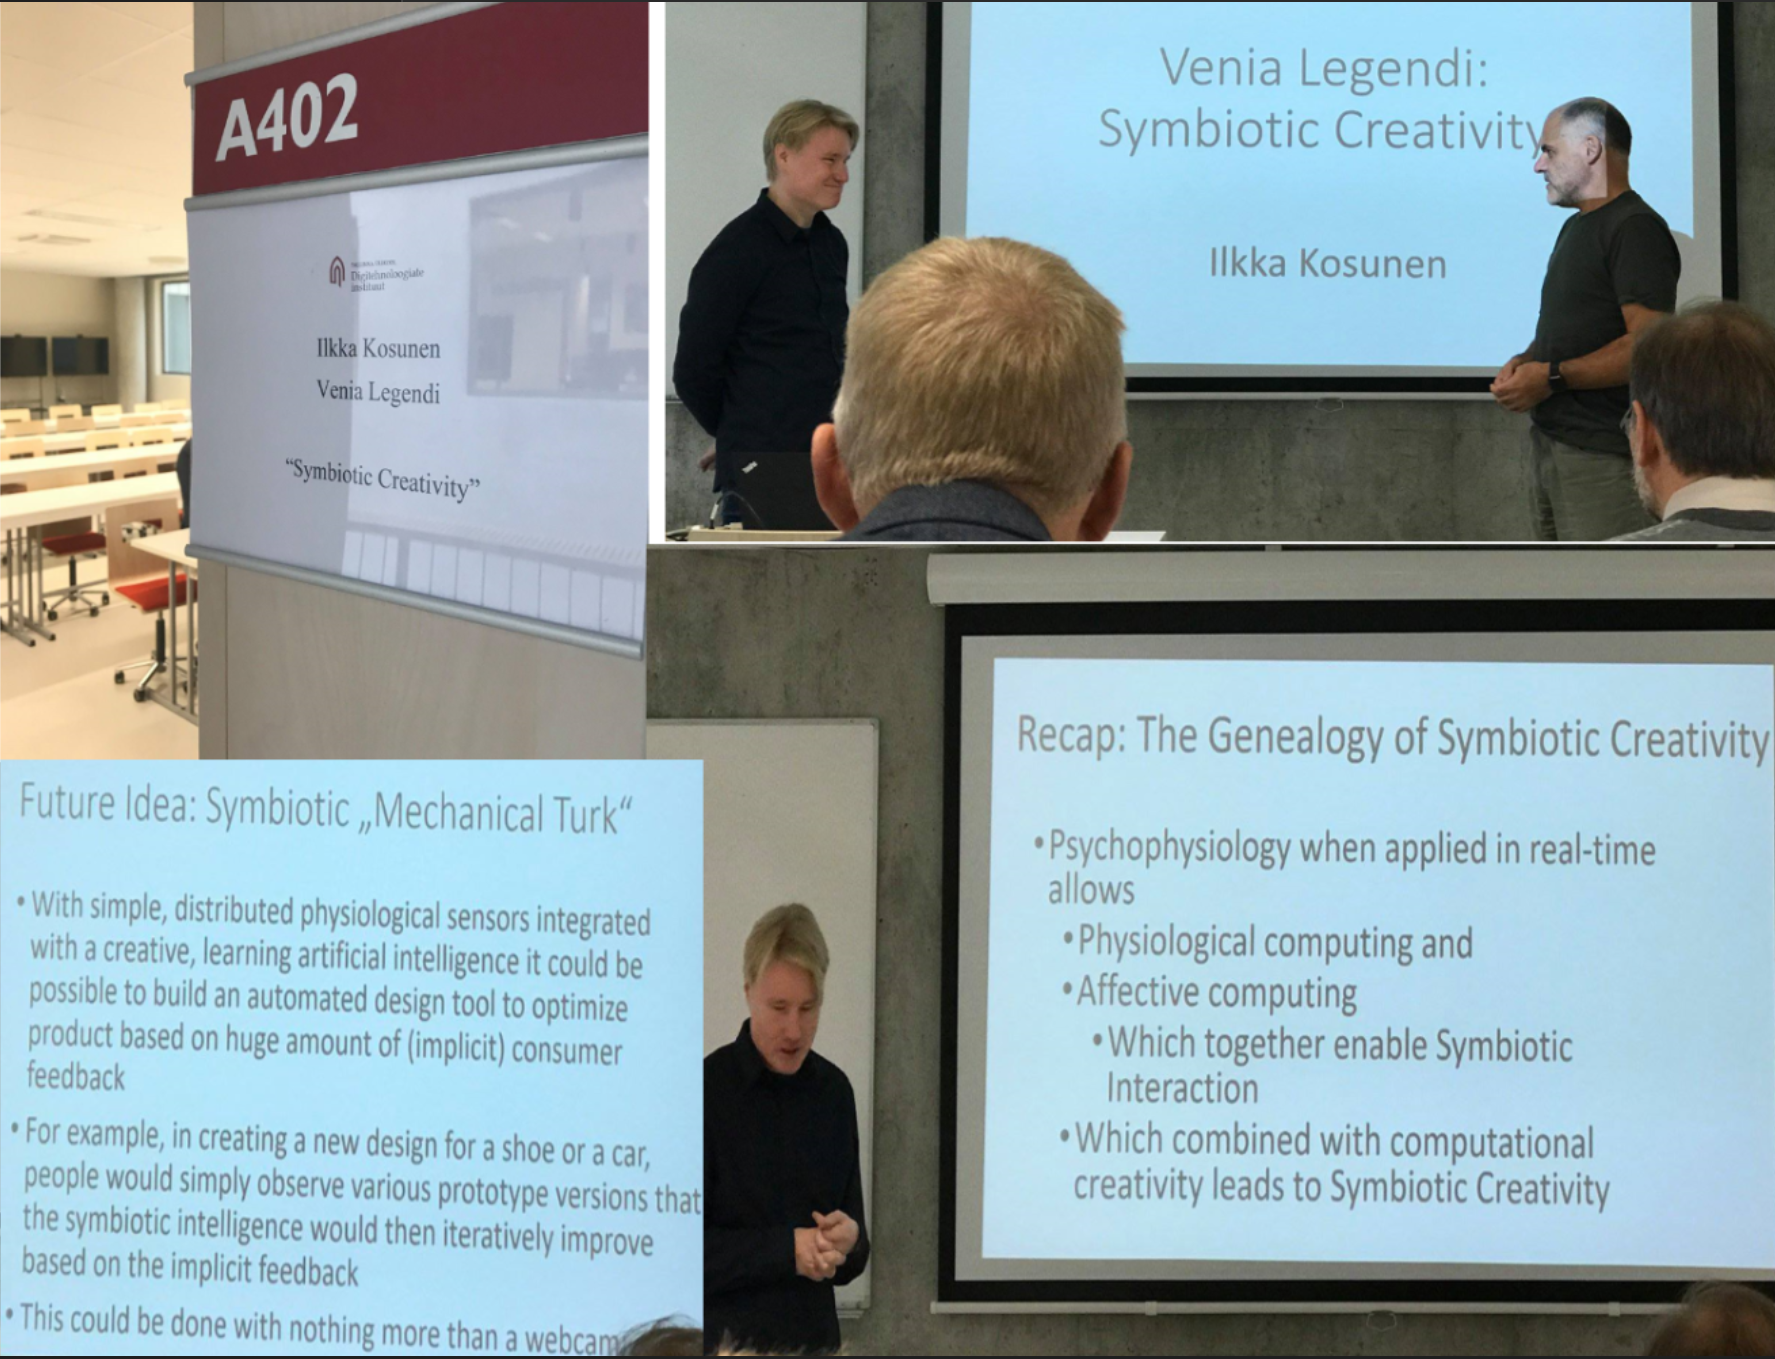
Symbiotic creativity…

resources