study notes
Avro is a row-based format. It was created by Apache. Each record contains a header that describes the structure of the data in the record. This header is stored as JSON. The data is stored as binary information. An application uses the information in the header to parse the binary data and extract the fields it contains. Avro is a good format for compressing data and minimizing storage and network bandwidth requirements.
ORC (Optimized Row Columnar format) organizes data into columns rather than rows. It was developed by HortonWorks for optimizing read and write operations in Apache Hive (Hive is a data warehouse system that supports fast data summarization and querying over large datasets). An ORC file contains stripes of data. Each stripe holds the data for a column or set of columns. A stripe contains an index into the rows in the stripe, the data for each row, and a footer that holds statistical information (count, sum, max, min, and so on) for each column.
Parquet is another columnar data format. It was created by Cloudera and Twitter. A Parquet file contains row groups. Data for each column is stored together in the same row group. Each row group contains one or more chunks of data. A Parquet file includes metadata that describes the set of rows found in each chunk. An application can use this metadata to quickly locate the correct chunk for a given set of rows, and retrieve the data in the specified columns for these rows. Parquet specializes in storing and processing nested data types efficiently. It supports very efficient compression and encoding schemes.
Databases
Relational Databases
- Each instance of an entity is assigned a primary key that uniquely identifies it; and these keys are used to reference the entity instance in other tables.
- his use of keys to reference data entities enables a relational database to be normalized; which in part means the elimination of duplicate data values so that, for example, the details of an individual customer are stored only once; not for each sales order the customer places.
Non-relational databases: four common types
- Key-value databases : each record consists of a unique key and an associated value
- Document databases : specific form of key-value databases in which the vlaue is a JSON Document
- Column family databases : store tabular data comprising rows and columns, but you can divide the columns into groups known as column-families
- graph databases: store entities as nodes with linkes to define relationships between them
JSON
JSON is a ubiquitous format in which a hierarchical document schema is used to define data entities (objects) that have multiple attributes. Each attribute might be an object (or a collection of objects); objects are enclosed in braces ({..}) and collections are enclosed in square brackets ([..]). Attributes are represented by name : value pairs and separated by commas (,).
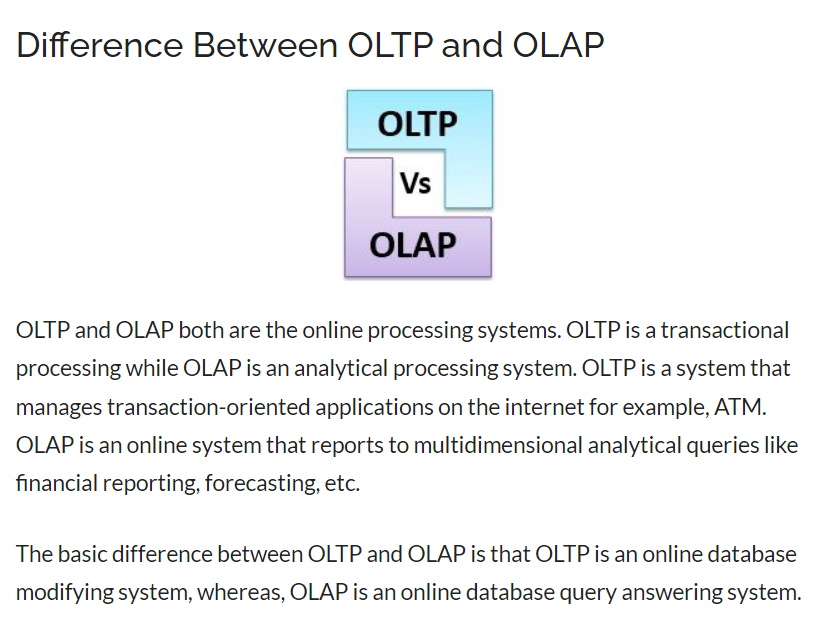
Transactional data processing
Think of a transaction as a small, discrete, unit of work. The work performed by transactional systems is often referred to as Online Transactional Processing (OLTP)
OLTP solutions rely on a database system in which data storage is optimized for both read and write operations in order to support transactional workloads in which data records are created, retrieved, updated, and deleted (often referred to as CRUD operations). These operations are applied transactionally, in a way that ensures the integrity of the data stored in the database. To accomplish this, OLTP systems enforce transactions that support so-called ACID semantics:
- Atomicity – each transaction is treated as a single unit, which succeeds completely or fails completely. For example, a transaction that involved debiting funds from one account and crediting the same amount to another account must complete both actions. If either action can’t be completed, then the other action must fail.
- Consistency – transactions can only take the data in the database from one valid state to another. To continue the debit and credit example above, the completed state of the transaction must reflect the transfer of funds from one account to the other.
- Isolation – concurrent transactions cannot interfere with one another, and must result in a consistent database state. For example, while the transaction to transfer funds from one account to another is in-process, another transaction that checks the balance of these accounts must return consistent results - the balance-checking transaction can’t retrieve a value for one account that reflects the balance before the transfer, and a value for the other account that reflects the balance after the transfer.
- Durability – when a transaction has been committed, it will remain committed. After the account transfer transaction has completed, the revised account balances are persisted so that even if the database system were to be switched off, the committed transaction would be reflected when it is switched on again.
analytical data processing
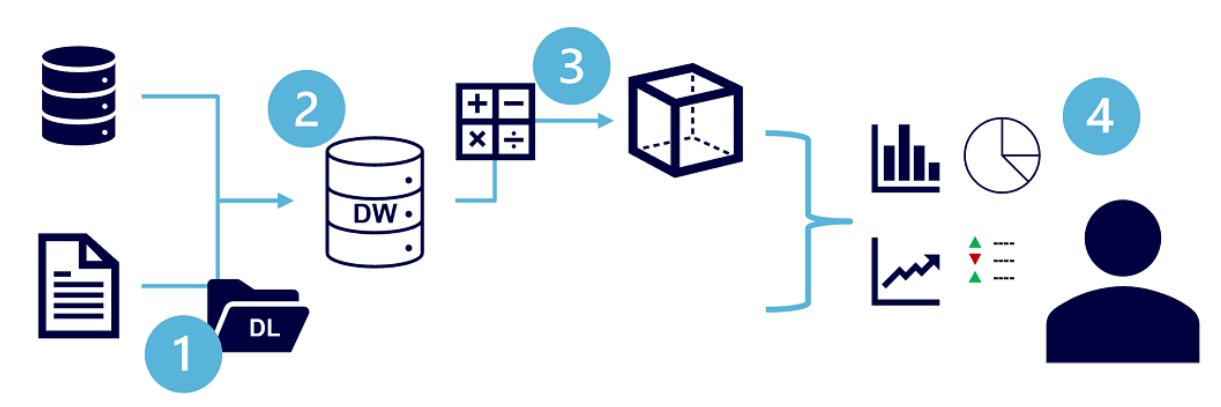
- Data files may be stored in a central data lake for analysis.
- An extract, transform, and load (ETL) process copies data from files and OLTP databases into a data warehouse that is optimized for read activity. Commonly, a data warehouse schema is based on fact tables that contain numeric values you want to analyze (for example, sales amounts), with related dimension tables that represent the entities by which you want to measure them (for example, customer or product),
- Data in the data warehouse may be aggregated and loaded into an online analytical processing (OLAP) model, or cube. Aggregated numeric values (measures) from fact tables are calculated for intersections of dimensions from dimension tables. For example, sales revenue might be totaled by date, customer, and product.
- The data in the data lake, data warehouse, and analytical model can be queried to produce reports, visualizations, and dashboards.
Data warehouses are an established way to store data in a relational schema that is optimized for read operations – primarily queries to support reporting and data visualization. The data warehouse schema may require some denormalization of data in an OLTP data source (introducing some duplication to make queries perform faster).
An OLAP model is an aggregated type of data storage that is optimized for analytical workloads. Data aggregations are across dimensions at different levels, enabling you to drill up/down to view aggregations at multiple hierarchical levels; for example to find total sales by region, by city, or for an individual address. Because OLAP data is pre-aggregated, queries to return the summaries it contains can be run quickly.
Data Roles and services
The three key job roles that deal with data in most organizations are:
- Database administrators manage databases, assigning permissions to users, storing backup copies of data and restore data in the event of a failure.
- Data engineers manage infrastructure and processes for data integration across the organization, applying data cleaning routines, identifying data governance rules, and implementing pipelines to transfer and transform data between systems.
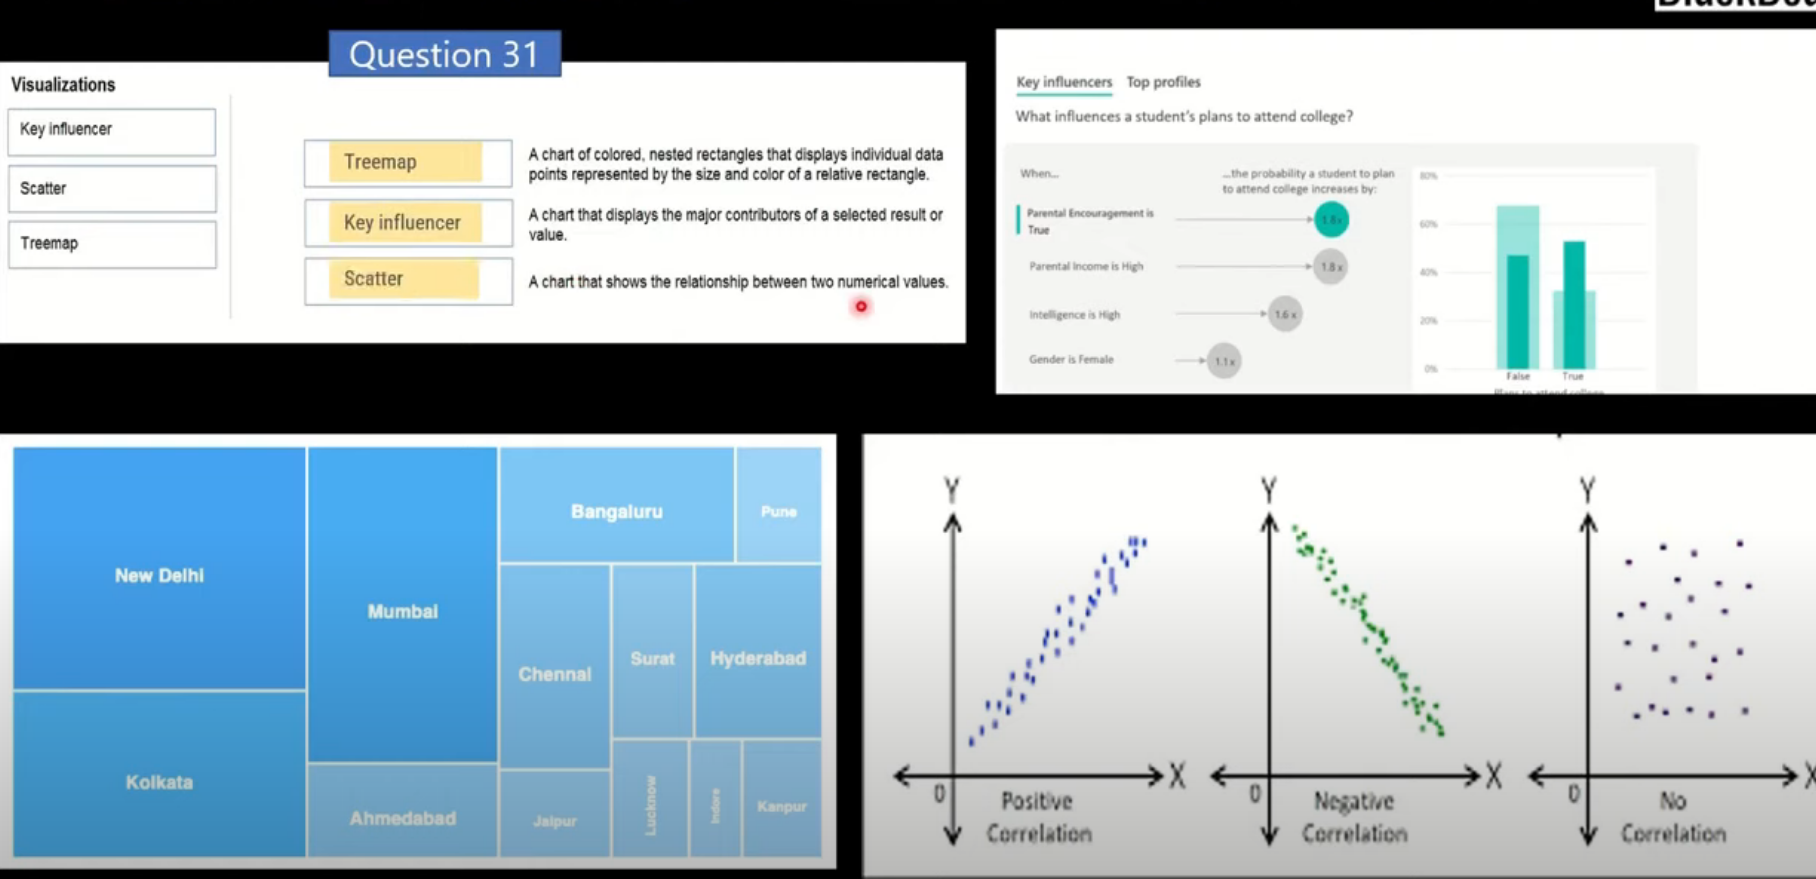
- Data analysts explore and analyze data to create visualizations and charts that enable organizations to make informed decisions.
Services
Azure SQL
- azure sql database
- Azure SQL managed instance
- Azure SQL VM
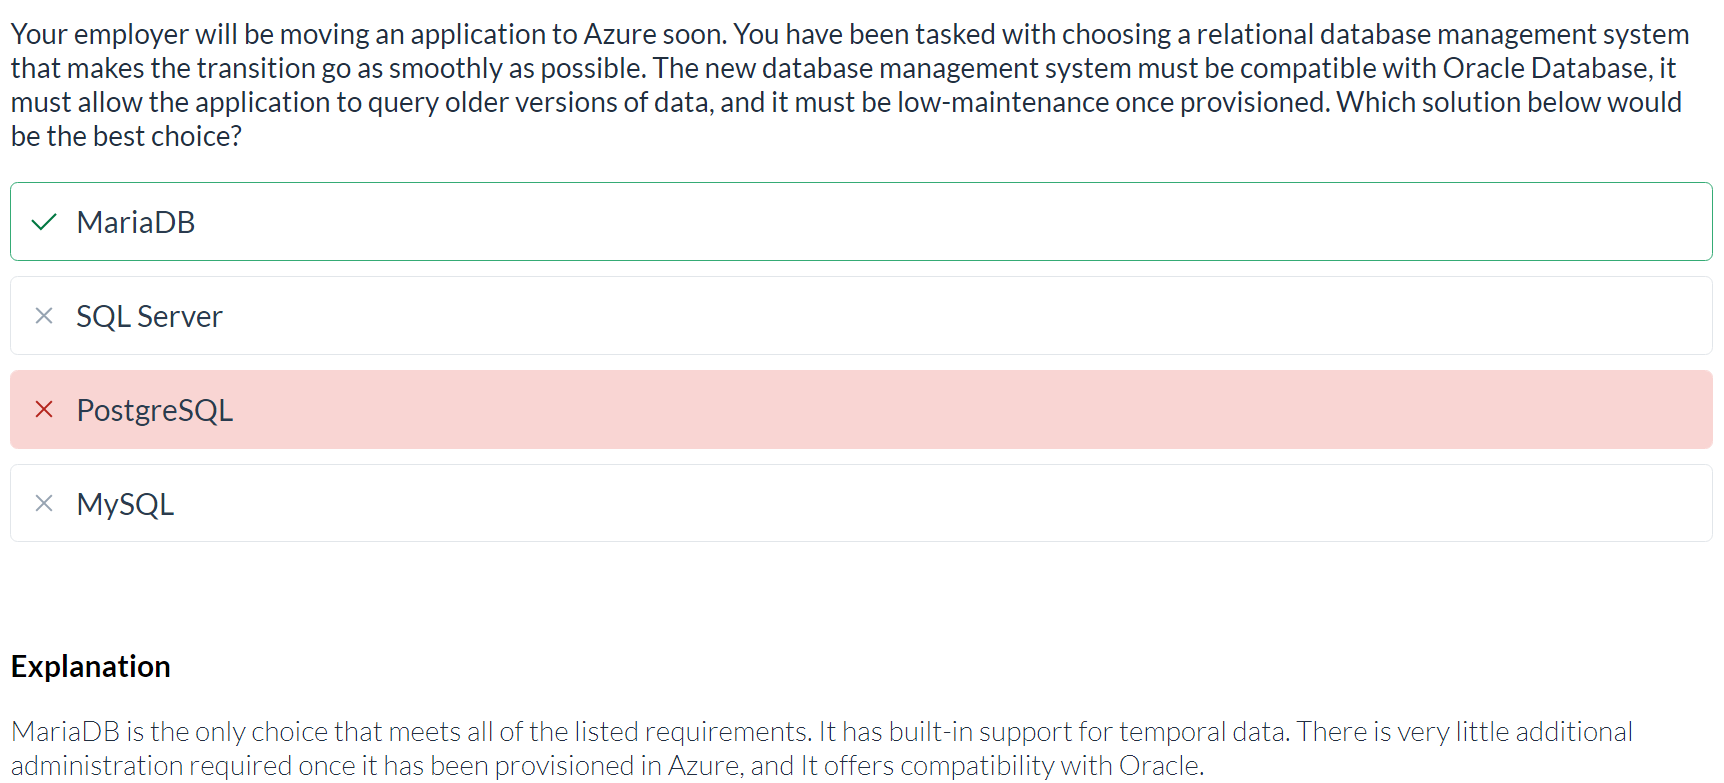
Azure DB for OS relational dbs
- Azure DB for MySql
- Azure DB for MariaDB
- Azurew DB for PostgreSQL
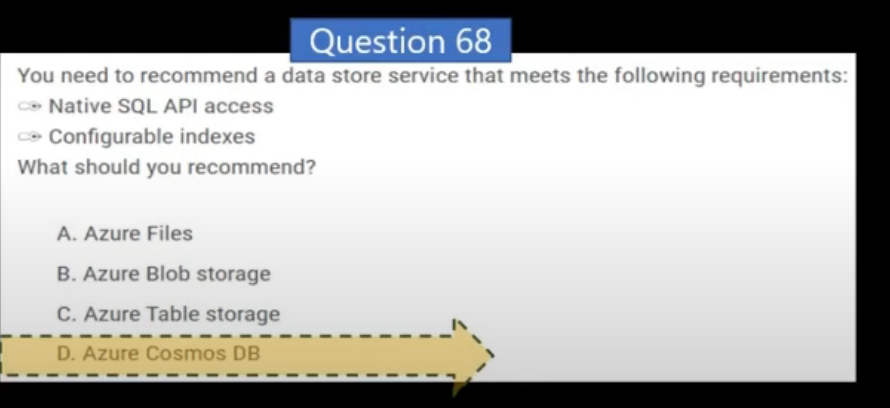
Azure Cosmos DB
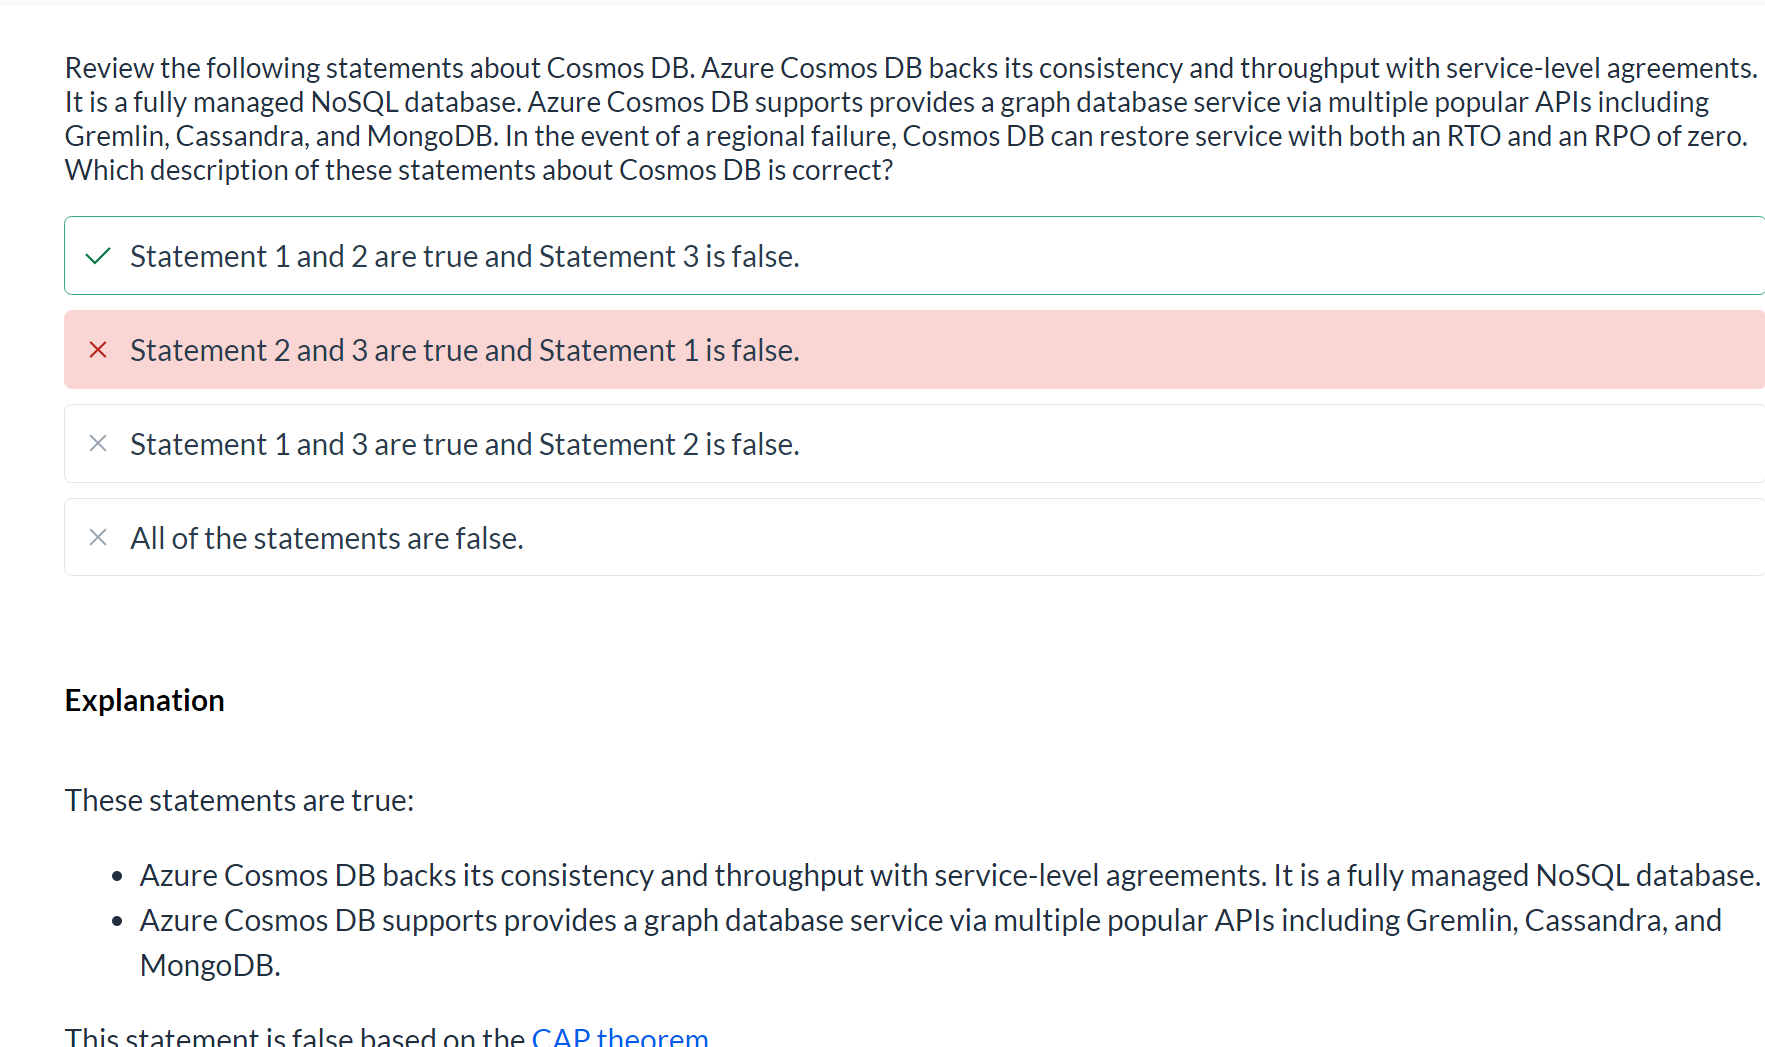
Azure Cosmos DB is a global-scale non-relational (NoSQL) database system that supports multiple application programming interfaces (APIs), enabling you to store and manage data as JSON documents, key-value pairs, column-families, and graphs.
Azure Storage
- Blob containers
- File shares
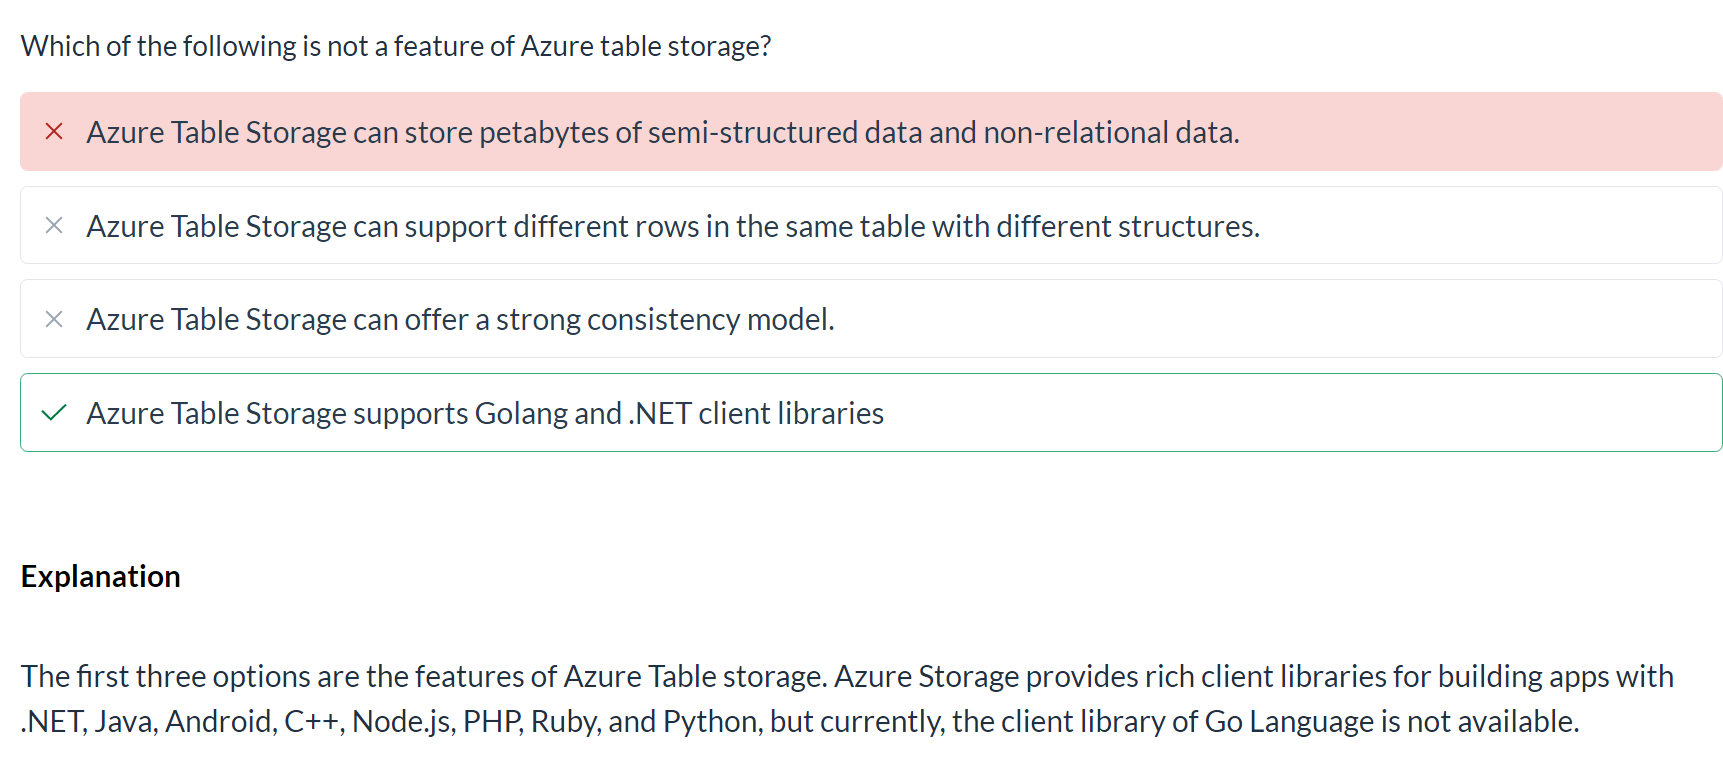
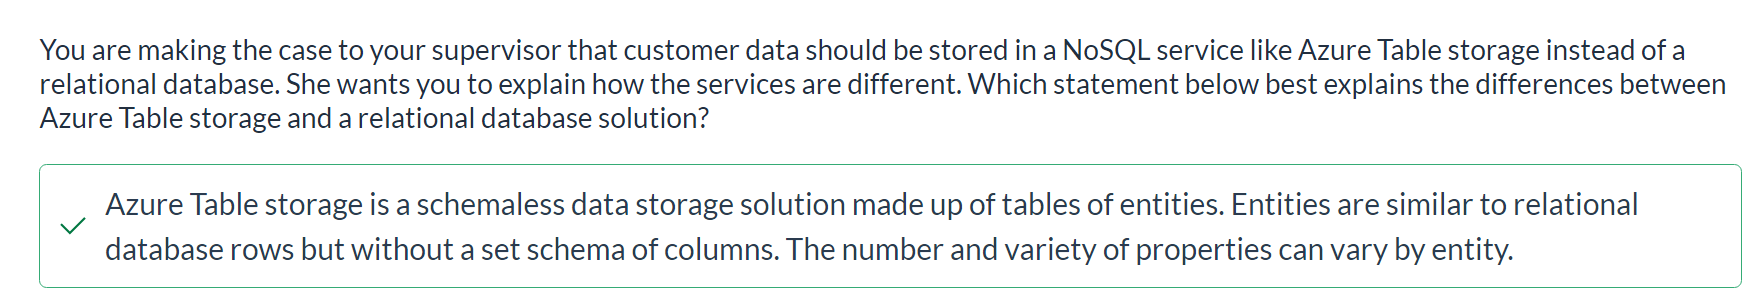
- Tables
Azure Data Factory
Azure Data Factory is used by data engineers to build extract, transform, and load (ETL) solutions that populate analytical data stores with data from transactional systems across the organization.
Azure Synapse Analytics
Azure Synapse Analytics is a comprehensive, unified data analytics solution that provides a single service interface for multiple analytical capabilities, including:
Pipelines - based on the same technology as Azure Data Factory. SQL - a highly scalable SQL database engine, optimized for data warehouse workloads. Apache Spark - an open-source distributed data processing system that supports multiple programming languages and APIs, including Java, Scala, Python, and SQL. Azure Synapse Data Explorer - a high-performance data analytics solution that is optimized for real-time querying of log and telemetry data using Kusto Query Language (KQL). Data engineers can use Azure Synapse Analytics to create a unified data analytics solution that combines data ingestion pipelines, data warehouse storage, and data lake storage through a single service.
Data analysts can use SQL and Spark pools through interactive notebooks to explore and analyze data, and take advantage of integration with services such as Azure Machine Learning and Microsoft Power BI to create data models and extract insights from the data.
Azure Databricks
Azure HDInsight
- Apache Spark - a distributed data processing system that supports multiple programming languages and APIs, including Java, Scala, Python, and SQL.
- Apache Hadoop - a distributed system that uses MapReduce jobs to process large volumes of data efficiently across multiple cluster nodes. MapReduce jobs can be written in Java or abstracted by interfaces such as Apache Hive - a SQL-based API that runs on Hadoop.
- Apache HBase - an open-source system for large-scale NoSQL data storage and querying.
- Apache Kafka - a message broker for data stream processing.
- Apache Storm - an open-source system for real-time data processing through a topology of spouts and bolts.
Azure Stream Analytics
Azure Stream Analytics is a real-time stream processing engine that captures a stream of data from an input, applies a query to extract and manipulate data from the input stream, and writes the results to an output for analysis or further processing.
Data engineers can incorporate Azure Stream Analytics into data analytics architectures that capture streaming data for ingestion into an analytical data store or for real-time visualization.
Azure Data Explorer
Azure Data Explorer is a standalone service that offers the same high-performance querying of log and telemetry data as the Azure Synapse Data Explorer runtime in Azure Synapse Analytics.
Data analysts can use Azure Data Explorer to query and analyze data that includes a timestamp attribute, such as is typically found in log files and Internet-of-things (IoT) telemetry data.
Microsoft Purview
Microsoft Purview provides a solution for enterprise-wide data governance and discoverability. You can use Microsoft Purview to create a map of your data and track data lineage across multiple data sources and systems, enabling you to find trustworthy data for analysis and reporting.
Data engineers can use Microsoft Purview to enforce data governance across the enterprise and ensure the integrity of data used to support analytical workloads.
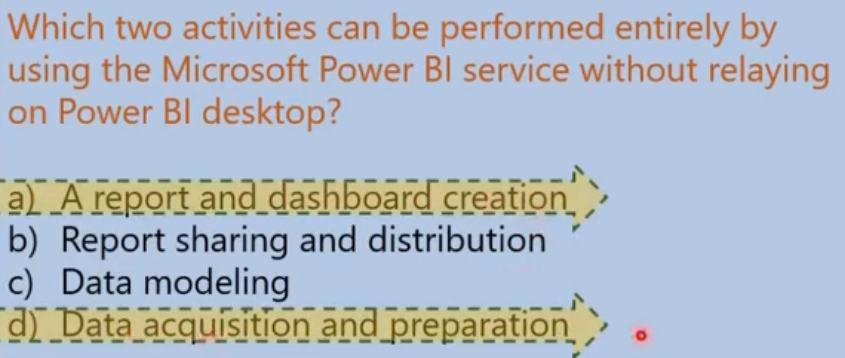
Microsoft Power BI
Relational Database Services in Azure
Relational data
In a relational database, you model collections of entities from the real world as tables. An entity can be anything for which you want to record information; typically important objects and events. For example, in a retail system example, you might create tables for customers, products, orders, and line items within an order. A table contains rows, and each row represents a single instance of an entity.
Normalization
Normalization is a term used by database professionals for a schema design process that minimizes data duplication and enforces data integrity.
While there are many complex rules that define the process of refactoring data into various levels (or forms) of normalization, a simple definition for practical purposes is:
- Separate each entity into its own table.
- Separate each discrete attribute into its own column.
- Uniquely identify each entity instance (row) using a primary key.
- Use foreign key columns to link related entities.
Describe Database Objects
View
A view is a virtual table based on the results of a SELECT query.
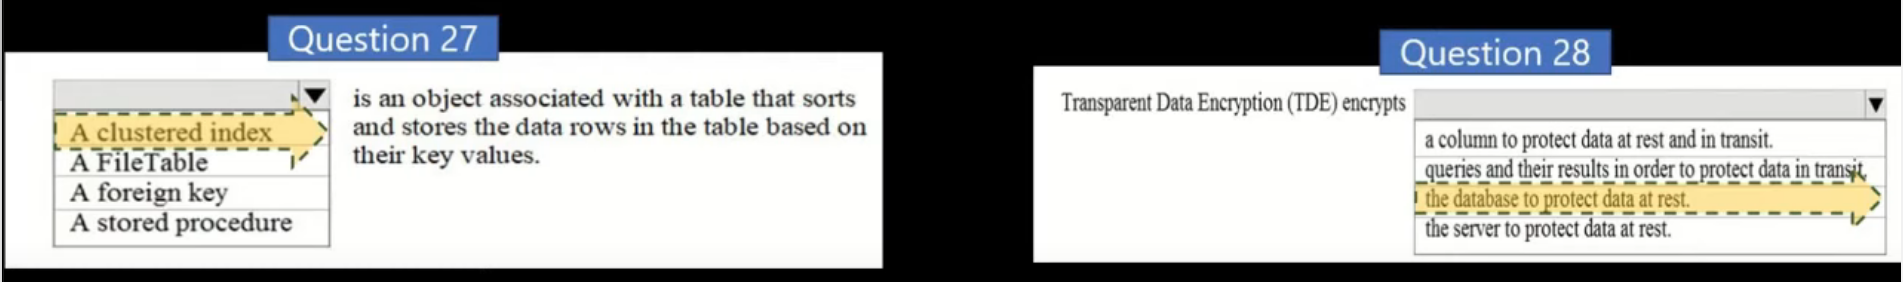
Stored Procedure
A stored procedure defines SQL statements that can be run on command. Stored procedures are used to encapsulate programmatic logic in a database for actions that applications need to perform when working with data.
You can define a stored procedure with parameters to create a flexible solution for common actions that might need to be applied to data based on a specific key or criteria. For example, the following stored procedure could be defined to change the name of a product based on the specified product ID.
CREATE PROCEDURE RenameProduct
	@ProductID INT,
	@NewName VARCHAR(20)
AS
UPDATE Product
SET Name = @NewName
WHERE ID = @ProductID;


-- and then:

EXEC RenameProduct 201, 'Spanner';
Index
When you create an index in a database, you specify a column from the table, and the index contains a copy of this data in a sorted order, with pointers to the corresponding rows in the table. When the user runs a query that specifies this column in the WHERE clause, the database management system can use this index to fetch the data more quickly than if it had to scan through the entire table row by row.’’
Non-relational data in Azure
Blobs
In an Azure storage account, you store blobs in containers. A container provides a convenient way of grouping related blobs together. You control who can read and write blobs inside a container at the container level.
Azure Blob Storage supports three different types of blob:
Block blobs. A block blob is handled as a set of blocks. Each block can vary in size, up to 100 MB. A block blob can contain up to 50,000 blocks, giving a maximum size of over 4.7 TB. The block is the smallest amount of data that can be read or written as an individual unit. Block blobs are best used to store discrete, large, binary objects that change infrequently. Page blobs. A page blob is organized as a collection of fixed size 512-byte pages. A page blob is optimized to support random read and write operations; you can fetch and store data for a single page if necessary. A page blob can hold up to 8 TB of data. Azure uses page blobs to implement virtual disk storage for virtual machines. Append blobs. An append blob is a block blob optimized to support append operations. You can only add blocks to the end of an append blob; updating or deleting existing blocks isn’t supported. Each block can vary in size, up to 4 MB. The maximum size of an append blob is just over 195 GB.
Streaming
Azure provides multiple technologies to implement real-time analytics:
- Azure Stream Analytics: a Paas solution that you can use to define streaming jobs that ingest data from a streaming source, apply a perpetual query, and write the result to an output
Spark Structured Streaming To process streaming data on Spark, you can use the Spark Structured Streaming library, which provides an application programming interface (API) for ingesting, processing, and outputting results from perpetual streams of data.
Spark Structured Streaming is built on a ubiquitous structure in Spark called a dataframe, which encapsulates a table of data. You use the Spark Structured Streaming API to read data from a real-time data source, such as a Kafka hub, a file store, or a network port, into a “boundless” dataframe that is continually populated with new data from the stream. You then define a query on the dataframe that selects, projects, or aggregates the data - often in temporal windows. The results of the query generate another dataframe, which can be persisted for analysis or further processing.
Data Warehousing
Data Warehouse
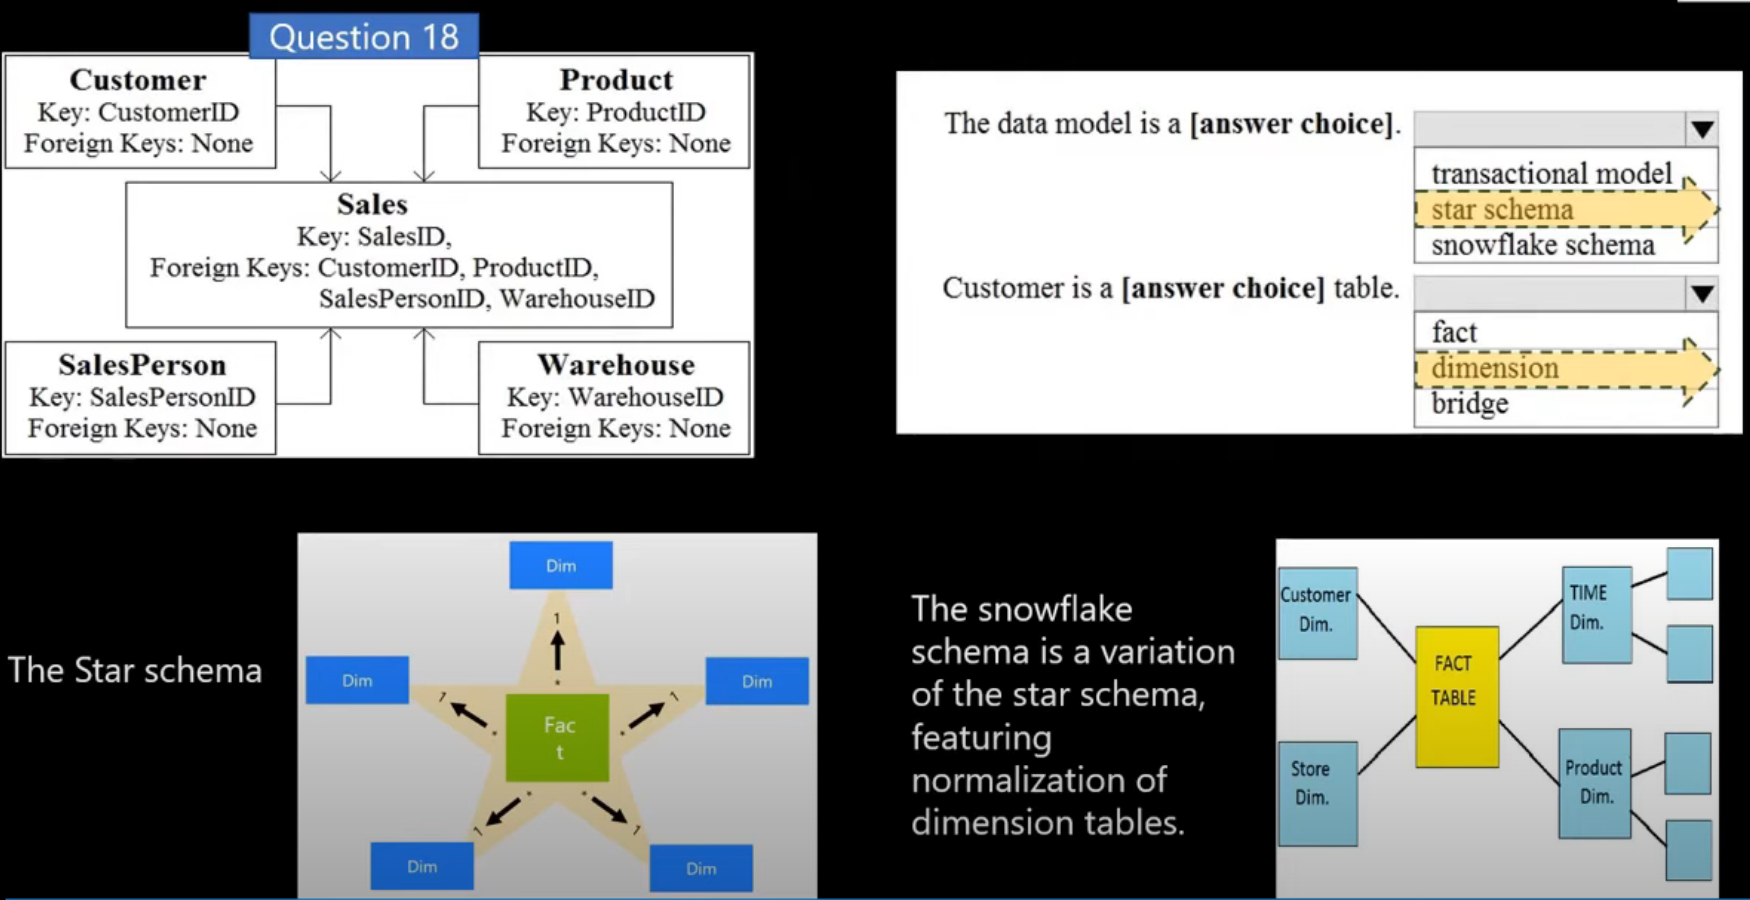
A data warehouse is a relational database in which the data is stored in a schema that is optimized for data analytics rather than transactional workloads. Commonly, the data from a transactional store is transformed into a schema in which numeric values are stored in central fact tables, which are related to one or more dimension tables that represent entities by which the data can be aggregated. For example a fact table might contain sales order data, which can be aggregated by customer, product, store, and time dimensions (enabling you, for example, to easily find monthly total sales revenue by product for each store). This kind of fact and dimension table schema is called a star schema; though it’s often extended into a snowflake schema by adding additional tables related to the dimension tables to represent dimensional hierarchies (for example, product might be related to product categories). A data warehouse is a great choice when you have transactional data that can be organized into a structured schema of tables, and you want to use SQL to query them.
Data lakes
A data lake is a file store, usually on a distributed file system for high performance data access. Technologies like Spark or Hadoop are often used to process queries on the stored files and return data for reporting and analytics. These systems often apply a schema-on-read approach to define tabular schemas on semi-structured data files at the point where the data is read for analysis, without applying constraints when it’s stored. Data lakes are great for supporting a mix of structured, semi-structured, and even unstructured data that you want to analyze without the need for schema enforcement when the data is written to the store.
Hybrid
You can use a hybrid approach that combines features of data lakes and data warehouses in a lake database or data lakehouse. The raw data is stored as files in a data lake, and a relational storage layer abstracts the underlying files and expose them as tables, which can be queried using SQL. SQL pools in Azure Synapse Analytics include PolyBase, which enables you to define external tables based on files in a datalake (and other sources) and query them using SQL. Synapse Analytics also supports a Lake Database approach in which you can use database templates to define the relational schema of your data warehouse, while storing the underlying data in data lake storage – separating the storage and compute for your data warehousing solution. Data lakehouses are a relatively new approach in Spark-based systems, and are enabled through technologies like Delta Lake; which adds relational storage capabilities to Spark, so you can define tables that enforce schemas and transactional consistency, support batch-loaded and streaming data sources, and provide a SQL API for querying.
Azure Services for Analytical Stores
Synapse Analytics
Data modeling
Models are based on related tables of data and define the numeric values that you want to analyze or report (known as measures) and the entities by which you want to aggregate them (known as dimensions).
Dimension tables represent the entities by which you want to aggregate numeric measures – for example product or customer. Each entity is represented by a row with a unique key value.
The numeric measures that will be aggregated by the various dimensions in the model are stored in Fact tables. Each row in a fact table represents a recorded event that has numeric measures associated with it
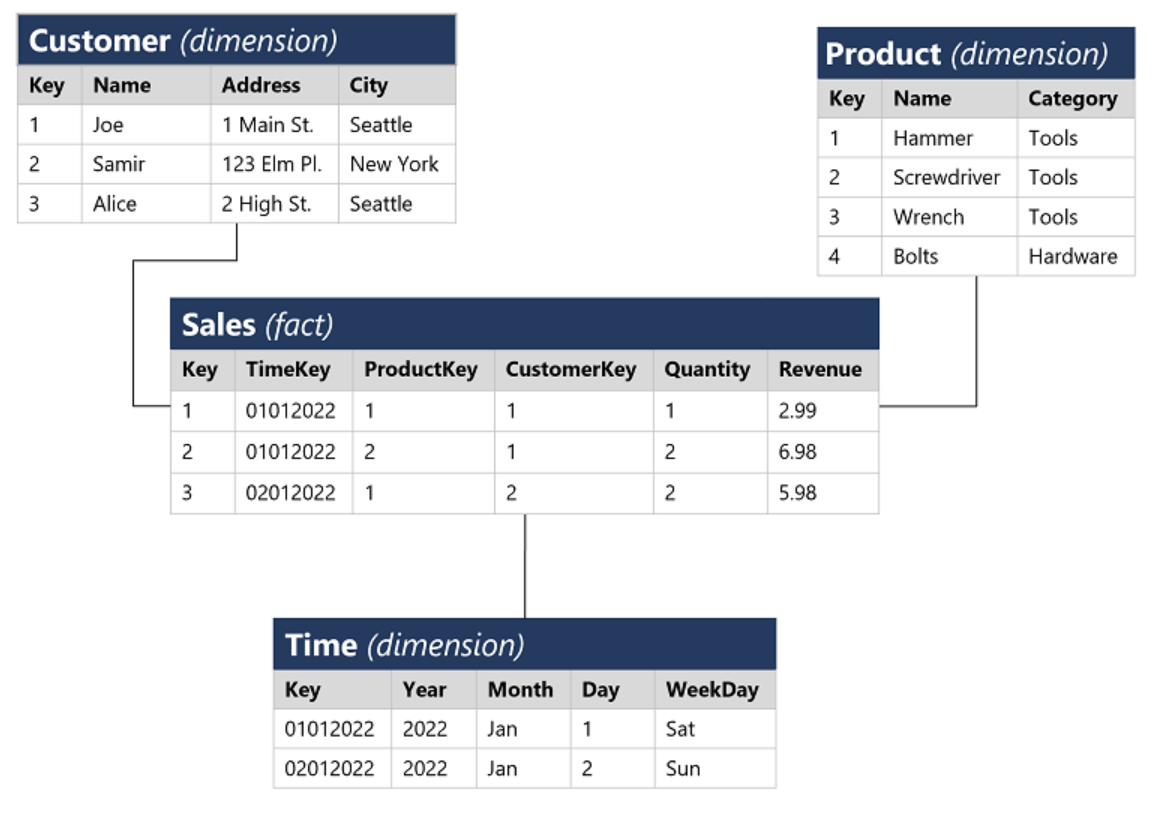
This type of schema, where a fact table is related to one or more dimension tables, is referred to as a star schema (imagine there are five dimensions related to a single fact table – the schema would form a five-pointed star!). You can also define a more complex schema in which dimension tables are related to additional tables containing more details (for example, you could represent attributes of product categories in a separate Category table that is related to the Product table – in which case the design is referred to as a snowflake schema.
# SCRAM time!
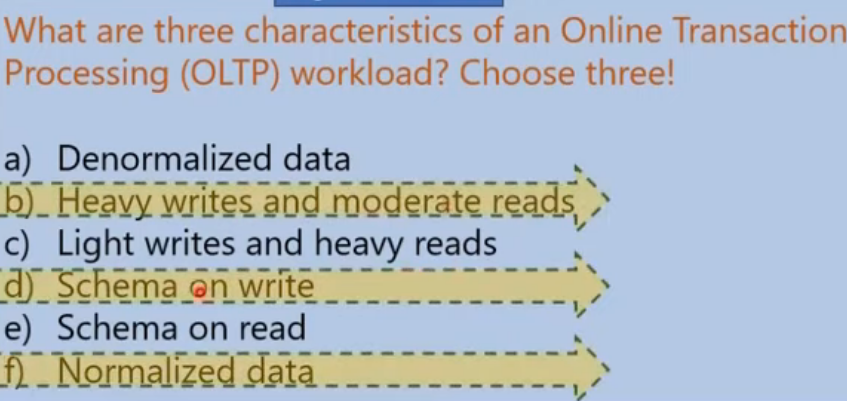 notice that OLAP would have opposite answers.